These 2 maps show the difference we are making— And what we want to do more of!
If you are reading this, you probably already know that Tacoma needs trees. We have the lowest tree canopy coverage of any city in Western Washington, and those trees are concentrated in parks, steep slopes, and wealthier/whiter neighborhoods. Parts of the city with more social and economic opportunity benefit from 15% more tree coverage than other areas, which is a big deal when the overall city average is only 20%!
This is what we mean when we talk about moving toward “tree equity”: making sure that as we grow our urban tree canopy, we do it by being strategic about where most of those trees are going and who is going to benefit.
One way to measure our impact is to track where our trees are being planted. When we share trees with people or organize community planting events, are more plants going into high-opportunity neighborhoods, or to neighborhoods where they will have a greater social, economic, and environmental impact? Are they adding shade to neighborhoods that are already greener, or to places with too much pavement that tend to heat up in the summer?
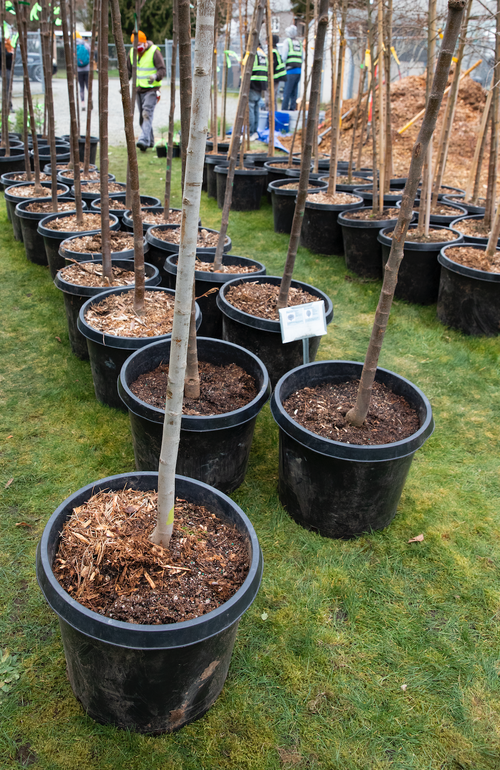
New data from our Branch Out event this February offers a promising look at our impact. Branch Out was a true community effort, with TTF collaborating with the City of Tacoma, Pierce Conservation District (PCD), Valeo Vocation, and our amazing host on the Hilltop, the Homeownership Center Northwest. Together, we distributed 272 trees, 39 of which were planted by 8 crews of volunteers! If all these trees survive to maturity, it will mean the addition of about three acres of tree canopy in Tacoma’s city limits!


But what about tree equity impacts? Our friends at PCD analyzed the data and punched it into GIS to find out!
This first map shows the addresses of everyone who received the trees (represented by the green dots). The background colors represent the redlining map of Tacoma from 1937, which contributed to racial segregation and our history of unequal investment across the city. The areas shaded in red and yellow were designated as lower priority for public investment; today, these areas tend to have less tree coverage, too. Cross-hatched areas (in black) are considered “communities of focus” for the Tacoma-Pierce County Health Department because of low public health outcomes. In short, the map shows how racial and income diversity correspond with tree coverage and community health in Tacoma.
Homes with newly planted trees from Branch Out
At our first Branch Out event, about 75 homes receiving trees were located in Hilltop, Eastside, South End, and South Tacoma, with about 21 properties in the North End, Central Tacoma, and Northeast Tacoma. That means roughly 78% of homes were within our priority neighborhoods!
The second map shows the impact in a slightly different way. In this case, the dots indicate the expected tree canopy added if those particular trees grow to maturity. The larger the dot, the more shade those trees will provide. In this case, the background layers come from the city’s urban heat data; the redder the neighborhood, the hotter it is. We are trying to change that, and this map shows the progress we can make when we have broad-based community support.
If you would like to learn more about tree equity and why it matters, please watch our special State of the Urban Forest presentation. Our guest speaker will be Dr. Vivek Shandas from Portland State University, a world-renowned expert on the urban heat island effect who produced the first heat map of Tacoma!